Unit9 worksheets
Unit9 worksheets
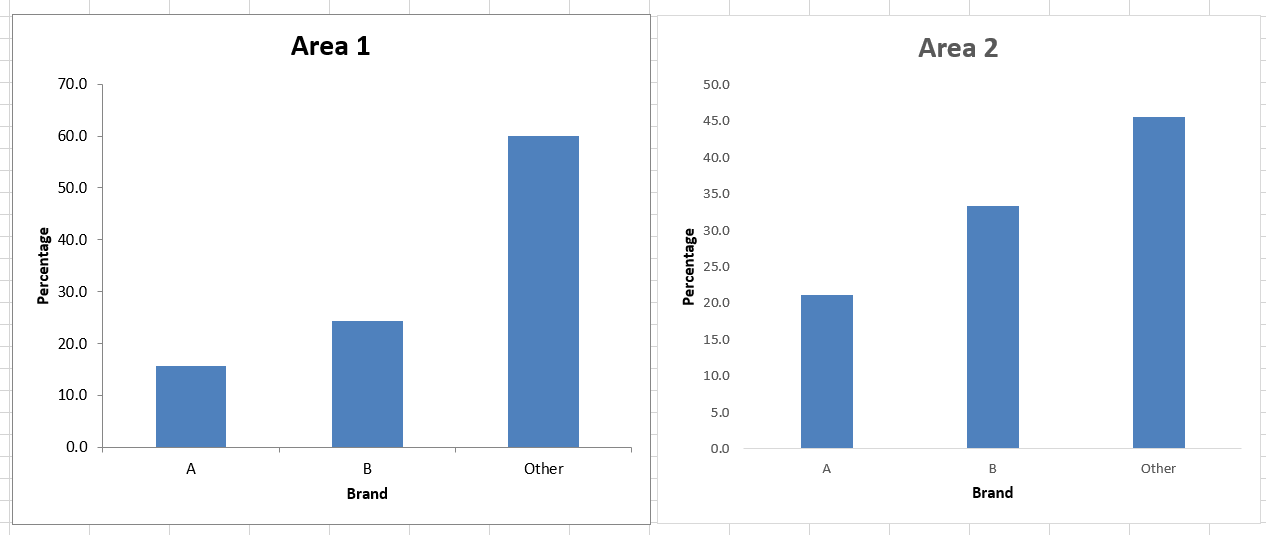
9.1D
From chart for Area2, its evident that Brand A is least preferred, followed by Brand B, whilst the majority of respondents preferred the other brand.
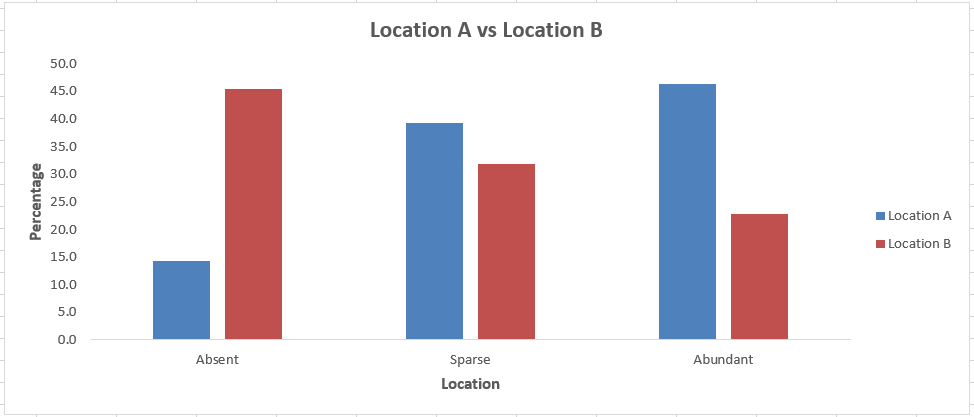
9.2E
It is clear from the chart that Absent in location B is higher than in location A, while we see the opposite for Sparse and Abundant where percentage value in Location A is higher than in Location B.
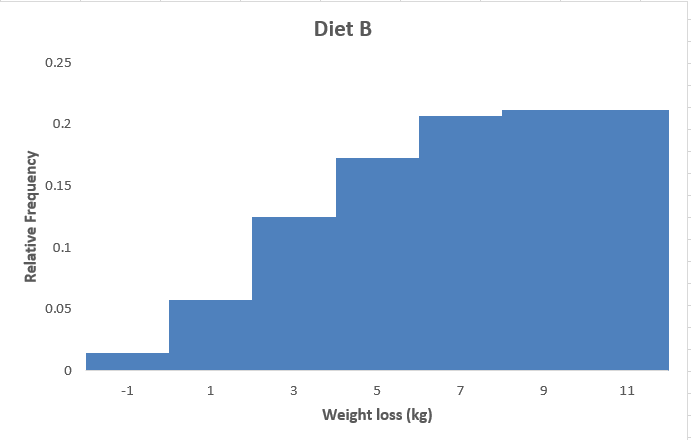
9.3B
The chart show skeness for those who did the diet B